Entity Analytics
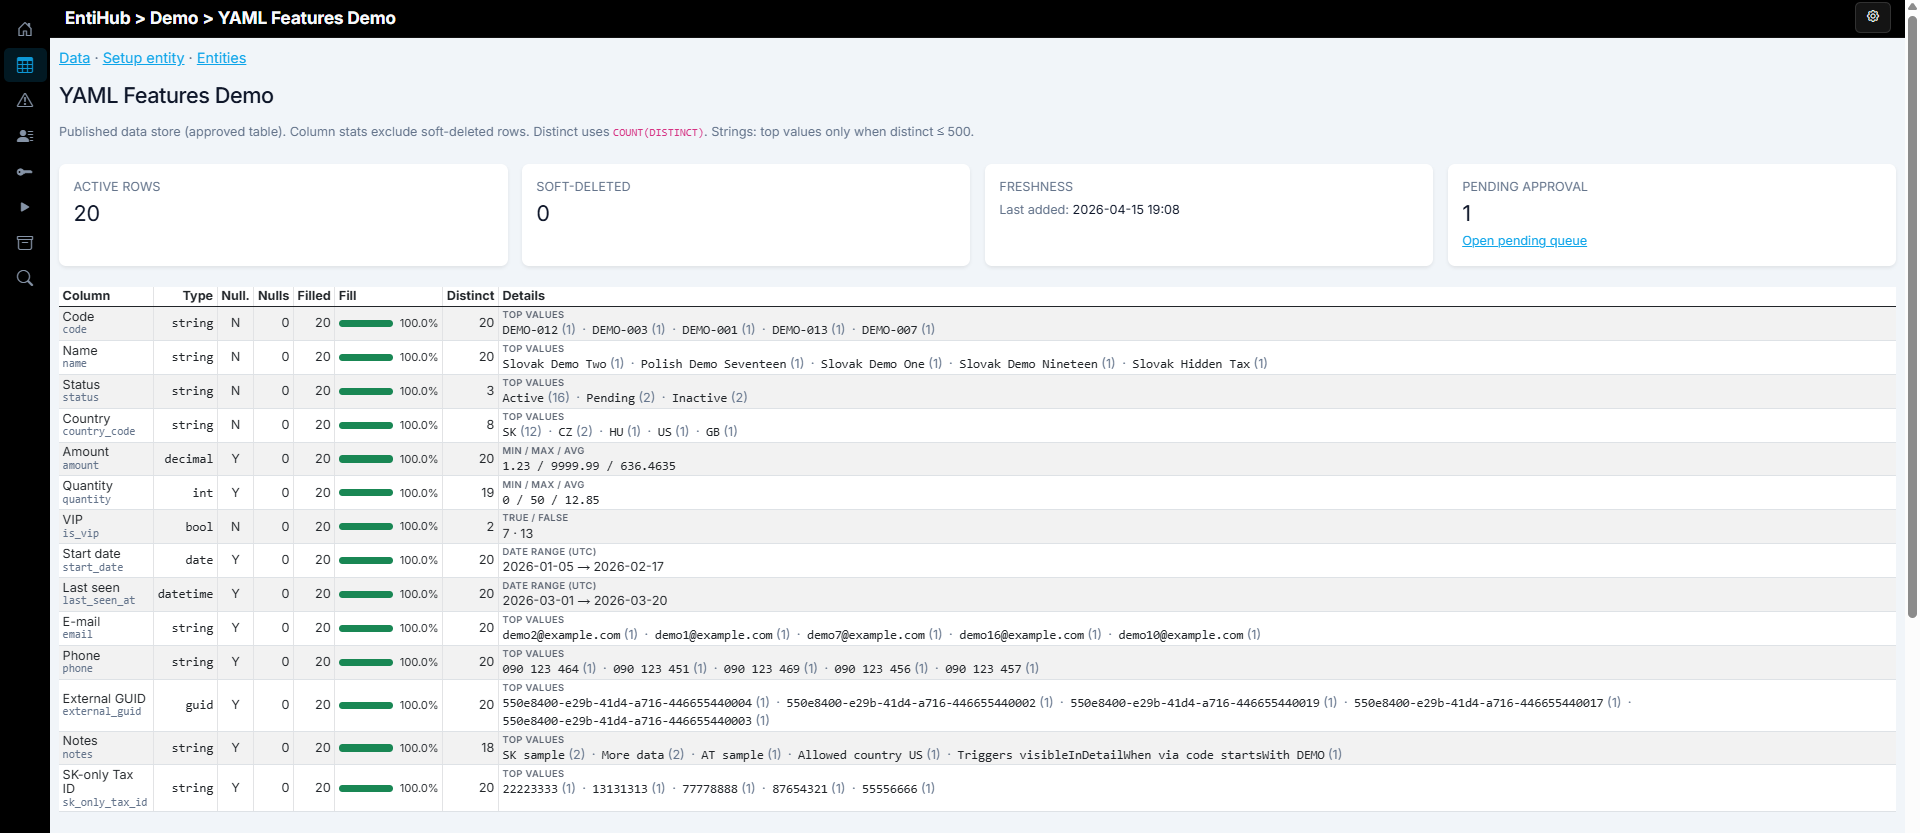
If you use the EntiHub Enterprise tier, you can view analytics information about entities. This view shows aggregated information for the selected entity.
You can see the number of active records, the number of soft-deleted records, and records in approval state. You can also see freshness information, which describes the latest changes in the entity.
In this analytical view, you also see a table with details for individual columns: data type, number of null values, column fill rate, number of unique values, and statistical summaries for each column.
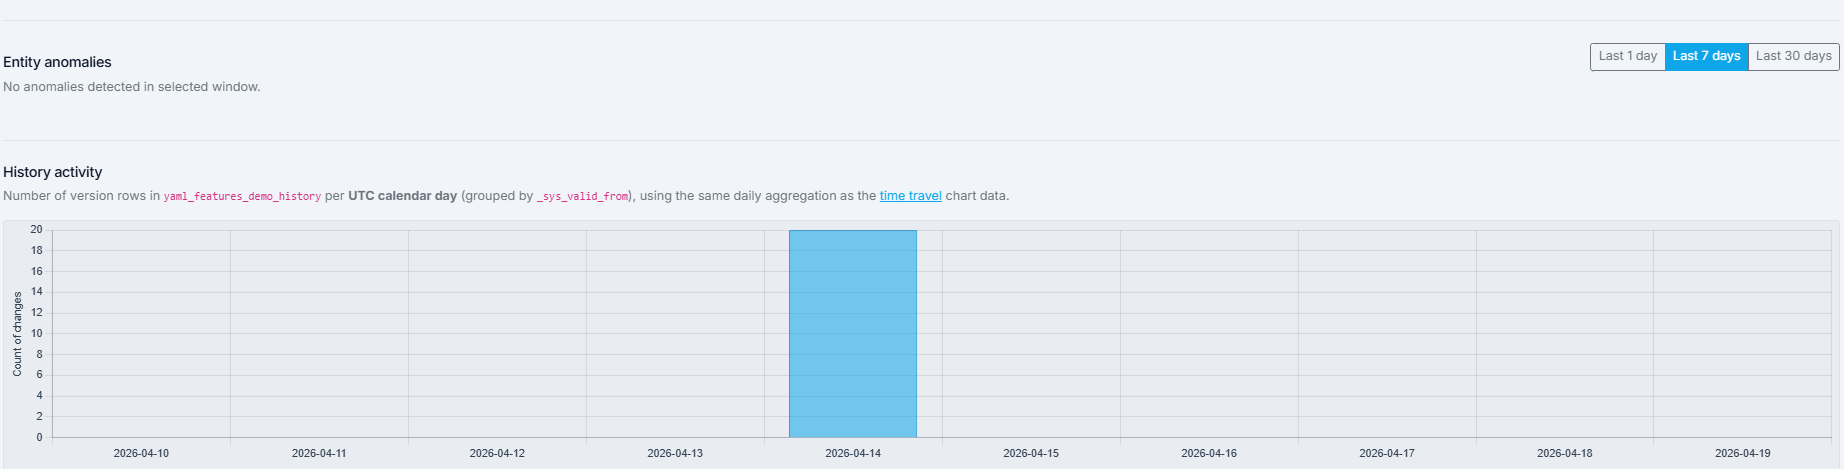
Below this table, you can find a list of identified anomalies (if anomaly detection is active for the entity) from the most recent period.
Finally, the last chart shows the trend in the number of changes over time, aggregated by day. This chart is available only for historized entities.
This view helps you quickly understand the nature and evolution of data in the selected entity.